
6 October 2025
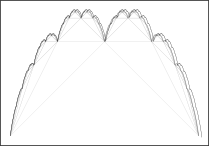
The #Mathober 2025 day 6 prompt is ‘Partial sum’. I offer a diagram of the #Fractal ‘blancmange curve’ or ‘Takagi curve’ and some of the partial sums that converge to it:
It is defined on the unit interval by
\[ y(x) = \sum_{n=0}^\infty \frac{s(2^n)}{n}, \]
where
\[ s(x) = \min_{n \in \mathbb{N}}|x - n|. \]
In the diagram, successive partial sums are shown in darkening shades of grey and (an approximation to) the curve itself in black.
The same diagram in PDF format, and the (not particularly efficient) Asymptote source code [GPL 3.0].