
9 October 2025
The #Mathober 2025 day 9 prompt is ‘Chi’. In graph theory, (\chi(G)) denotes the chromatic number of a graph (G): the minimum number of colours required to colour all vertices so that no adjacent vertices have the same colour.
The famous ‘four colour theorem’ says that all planar graphs (G) have (\chi(G) \leq 4). A graph is planar if it can be drawn in the plane without any edges crossing.
The conjecture originated in 1852 when Francis Guthrie (1831–99) noticed that it was possible to colour a map of England using only four colour so that no neighbouring counties received the same colour, and wondered if this held true for all maps. The question for maps is transformed into one for graphs by replacing each region by a vertex and placing edges between vertices corresponding to neighbouring regions.
Thus, for the Mathober prompt ‘Chi’, I offer a map of the counties of England as they were in Guthrie’s time and the corresponding graph, coloured in the same way with four colours.
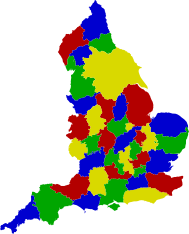
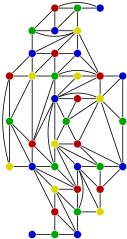
PDF format versions of the map and graph.
These diagrams first appeared as Figure 16.2 of A. J. Cain, Form & Number: A History of Mathematical Beauty (Lisbon, 2024). Chapter 16 is ‘Machine Aesthetics: Beauty, computers, and proof’ and in particular discusses aesthetic responses to the Haken–Appel computer proof of the four-colour theorem.
The map contains Ordinance Survey data © Crown copyright and database rights 2024 (Open Government Licence).